 We stand with our friends and colleagues in Ukraine.
To support Ukraine in their time of need
We stand with our friends and colleagues in Ukraine.
To support Ukraine in their time of need
Architecture
See also:
Jaeger v2 is designed to be a versatile and flexible tracing platform. It can be deployed as a single binary that can be configured to perform different roles within the Jaeger architecture.
Roles
- collector: Receives incoming trace data from applications and writes it into a storage backend.
- query: Serves the APIs and the user interface for querying and visualizing traces.
- ingester: Ingests spans from Kafka and writes them into a storage backend; useful when running in a split collector-Kafka-ingester configuration.
- all-in-one: Collector and query roles in a single process.
- agent: A host agent or a sidecar that runs next to the application and forwards trace data to the collector. While Jaeger can be configured for this role, we recommend using the standard OpenTelemetry Collector instead because you may likely need it to process other types of telemetry (metrics & logs).
Choosing between the all-in-one and the collector/query configurations is a matter of preference. When using external storage backend, both configurations are horizontally scalable, but the collector/query configuration allows to separate the read and write traffic and to scale them independently, as well as to apply different access and security policies.
The all-in-one configuration with in-memory storage is most suitable for development and testing, but it is not recommended for production since the data is lost on restarts. all-in-one with the Badger backend can be used in production, but only for modest data volumes since it is limited to a single instance and cannot be scaled horizontally.
Architecture choices
The two most common deployment options for a scalable Jaeger backend are direct-to-storage and using Kafka as a buffer.
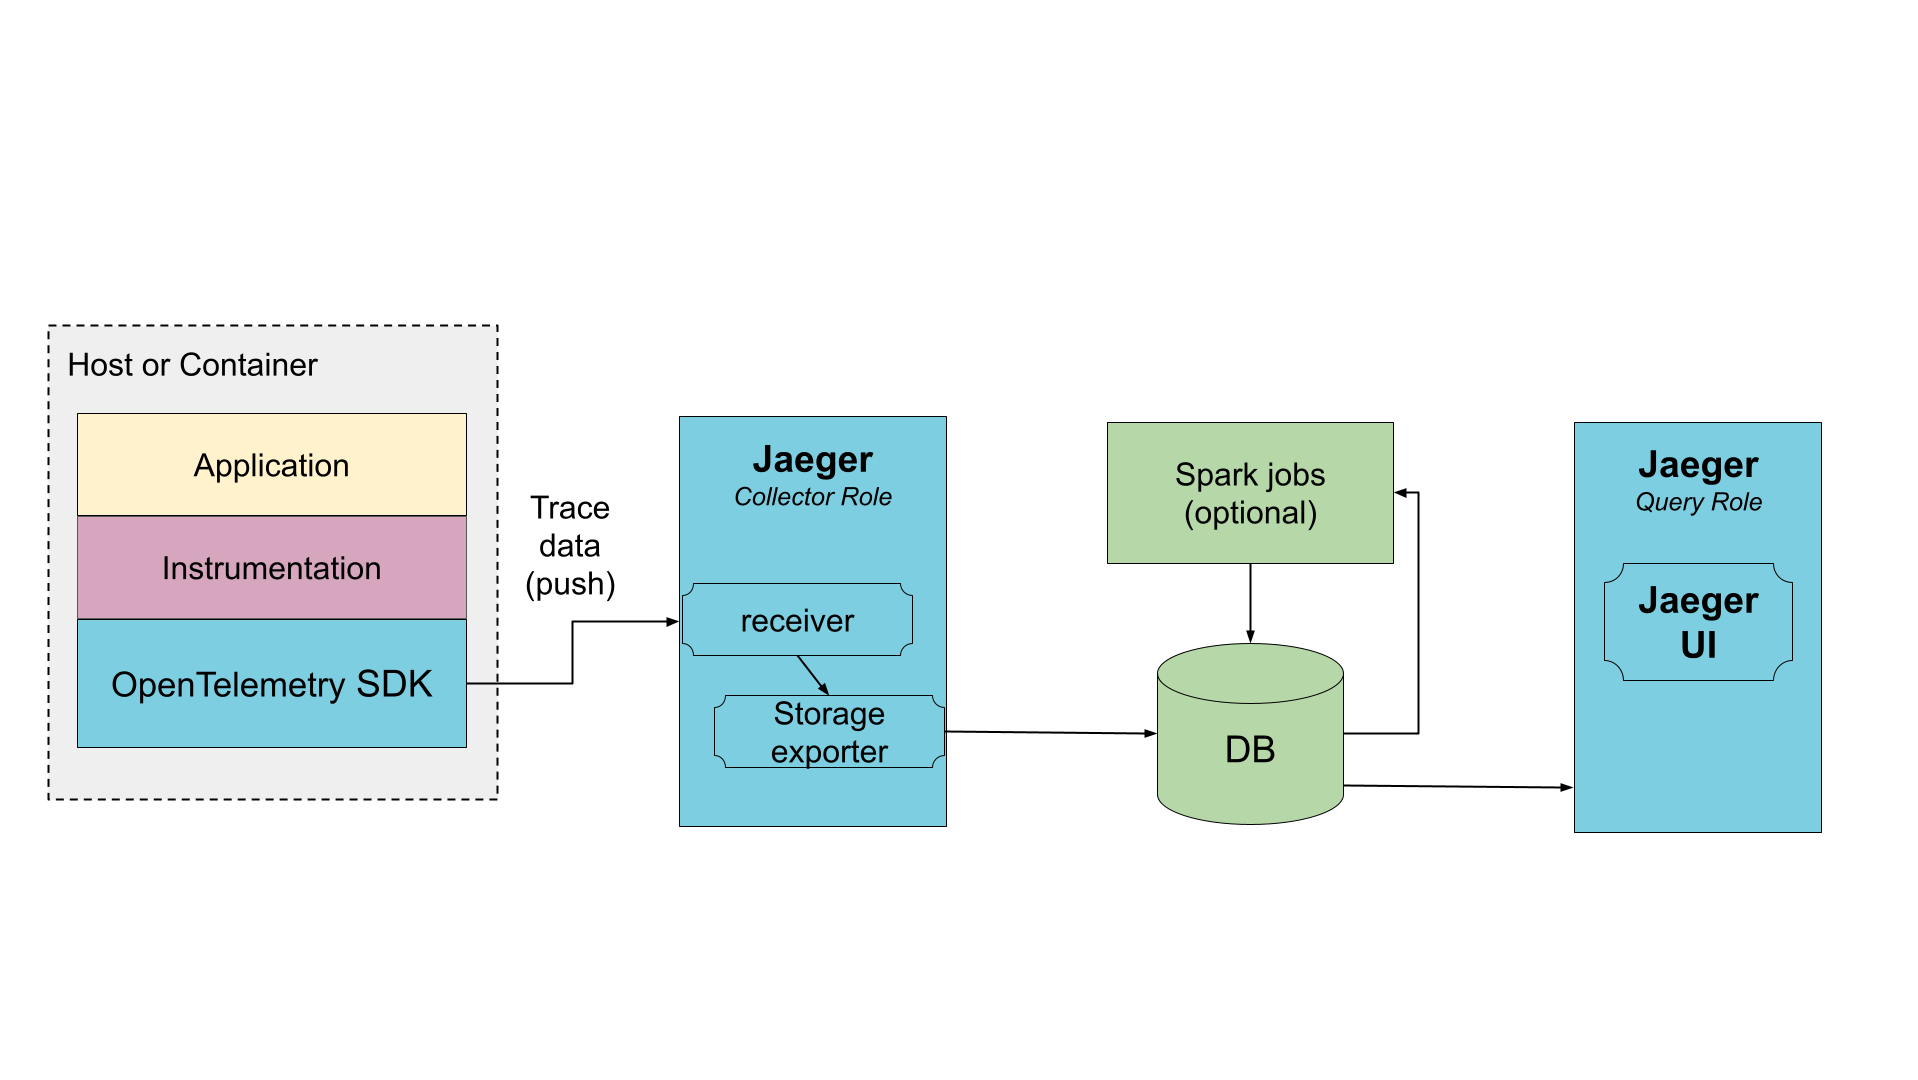
Direct to storage
In this deployment the collectors receive the data from traced applications and write it directly to storage. The storage must be able to handle both average and peak traffic. The collectors may use an in-memory queue to smooth short-term traffic peaks, but a sustained traffic spike may result in dropped data if the storage is not able to keep up.
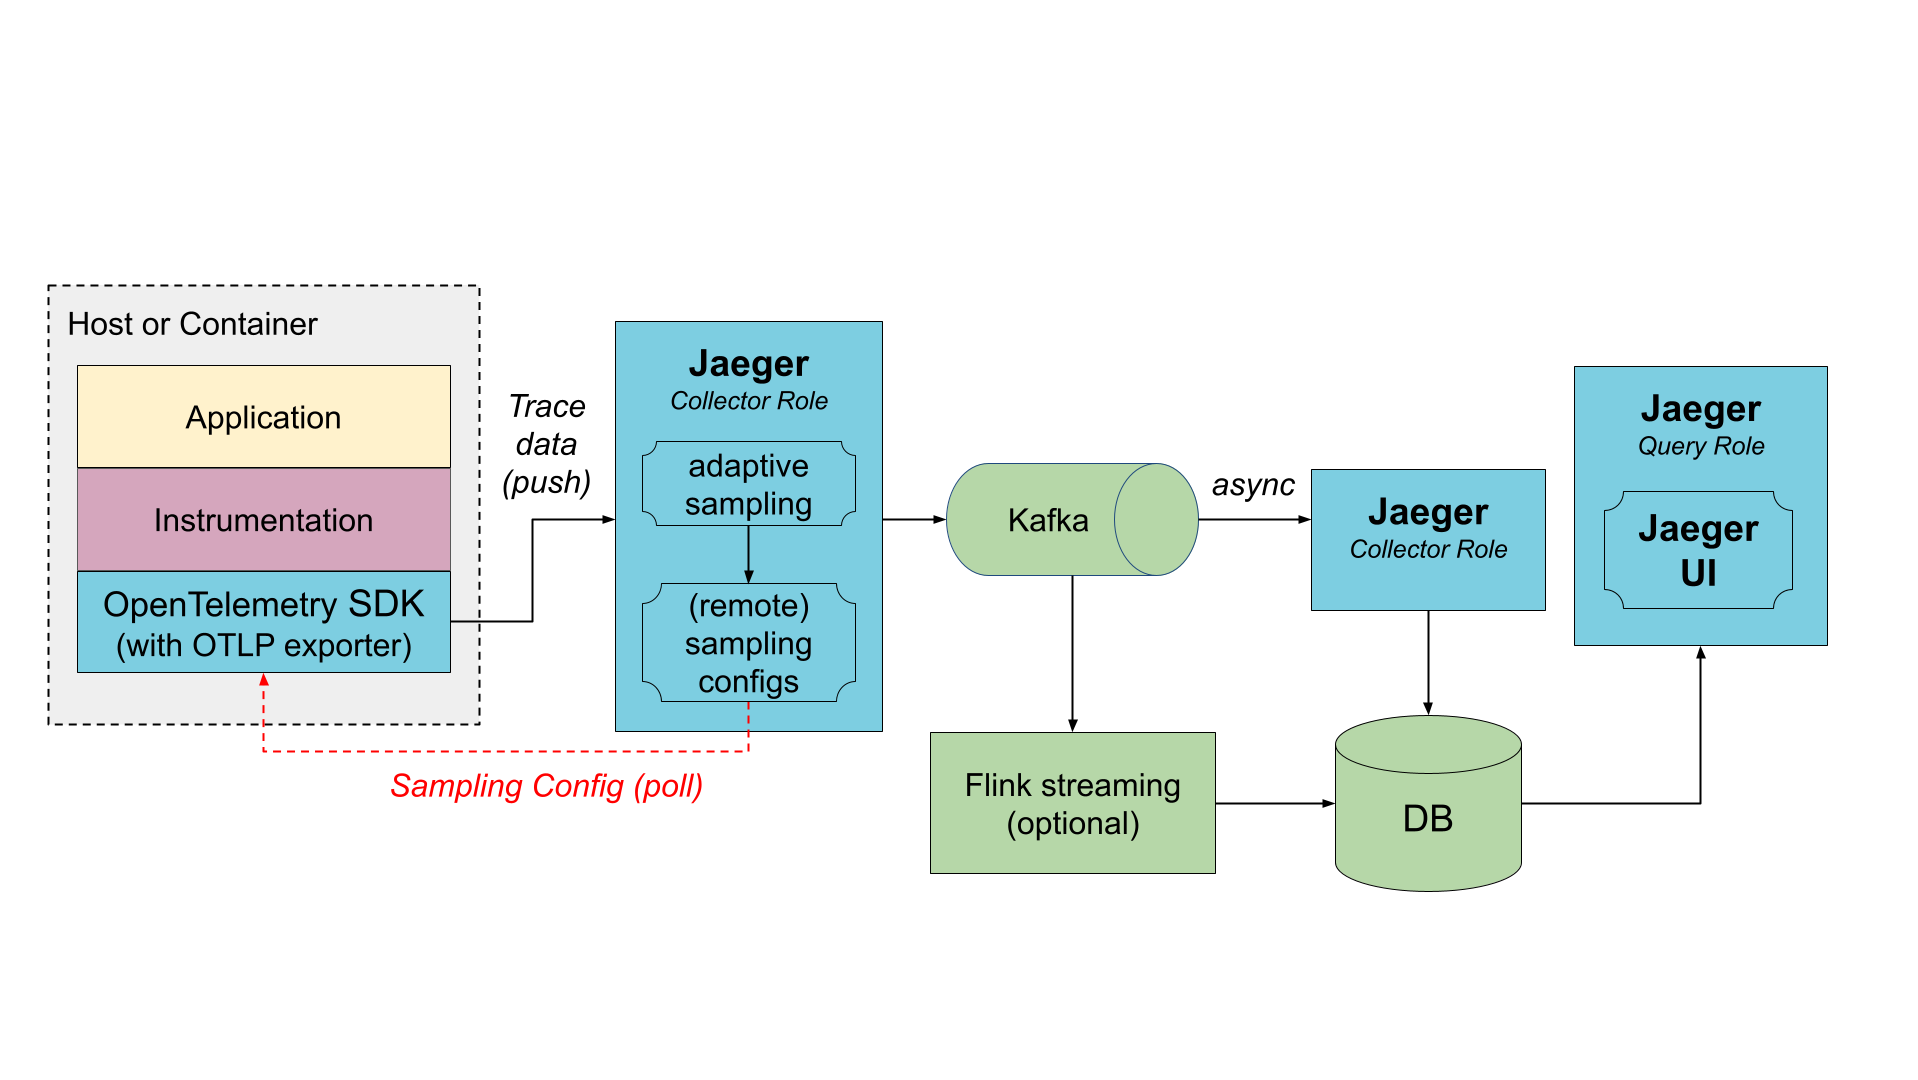
Via Kafka
To prevent data loss between collectors and storage, Kafka can be used as an intermediary, persistent queue. The collectors are configured with Kafka exporters. An additional component, ingester, needs to be deployed to read data from Kafka and save it to storage. Multiple ingesters can be deployed to scale up ingestion; they will automatically partition the load across them. In practice, an ingester is very similar to a collector, only configured with a Kafka receiver instead of RPC-based receivers.
With OpenTelemetry Collector
You do not need to use the OpenTelemetry Collector to operate Jaeger, because Jaeger is a customized distribution of the OpenTelemetry Collector with different roles. However, if you already use the OpenTelemetry Collectors, for gathering other types of telemetry or for pre-processing / enriching the tracing data, it can be placed in front of Jaeger in the collection pipeline. The OpenTelemetry Collectors can be run as an application sidecar, as a host agent / daemon, or as a remote service cluster.
The OpenTelemetry Collector supports Jaeger’s Remote Sampling protocol and can either serve static configurations from config files directly, or proxy the requests to the Jaeger backend (e.g., when using adaptive sampling).
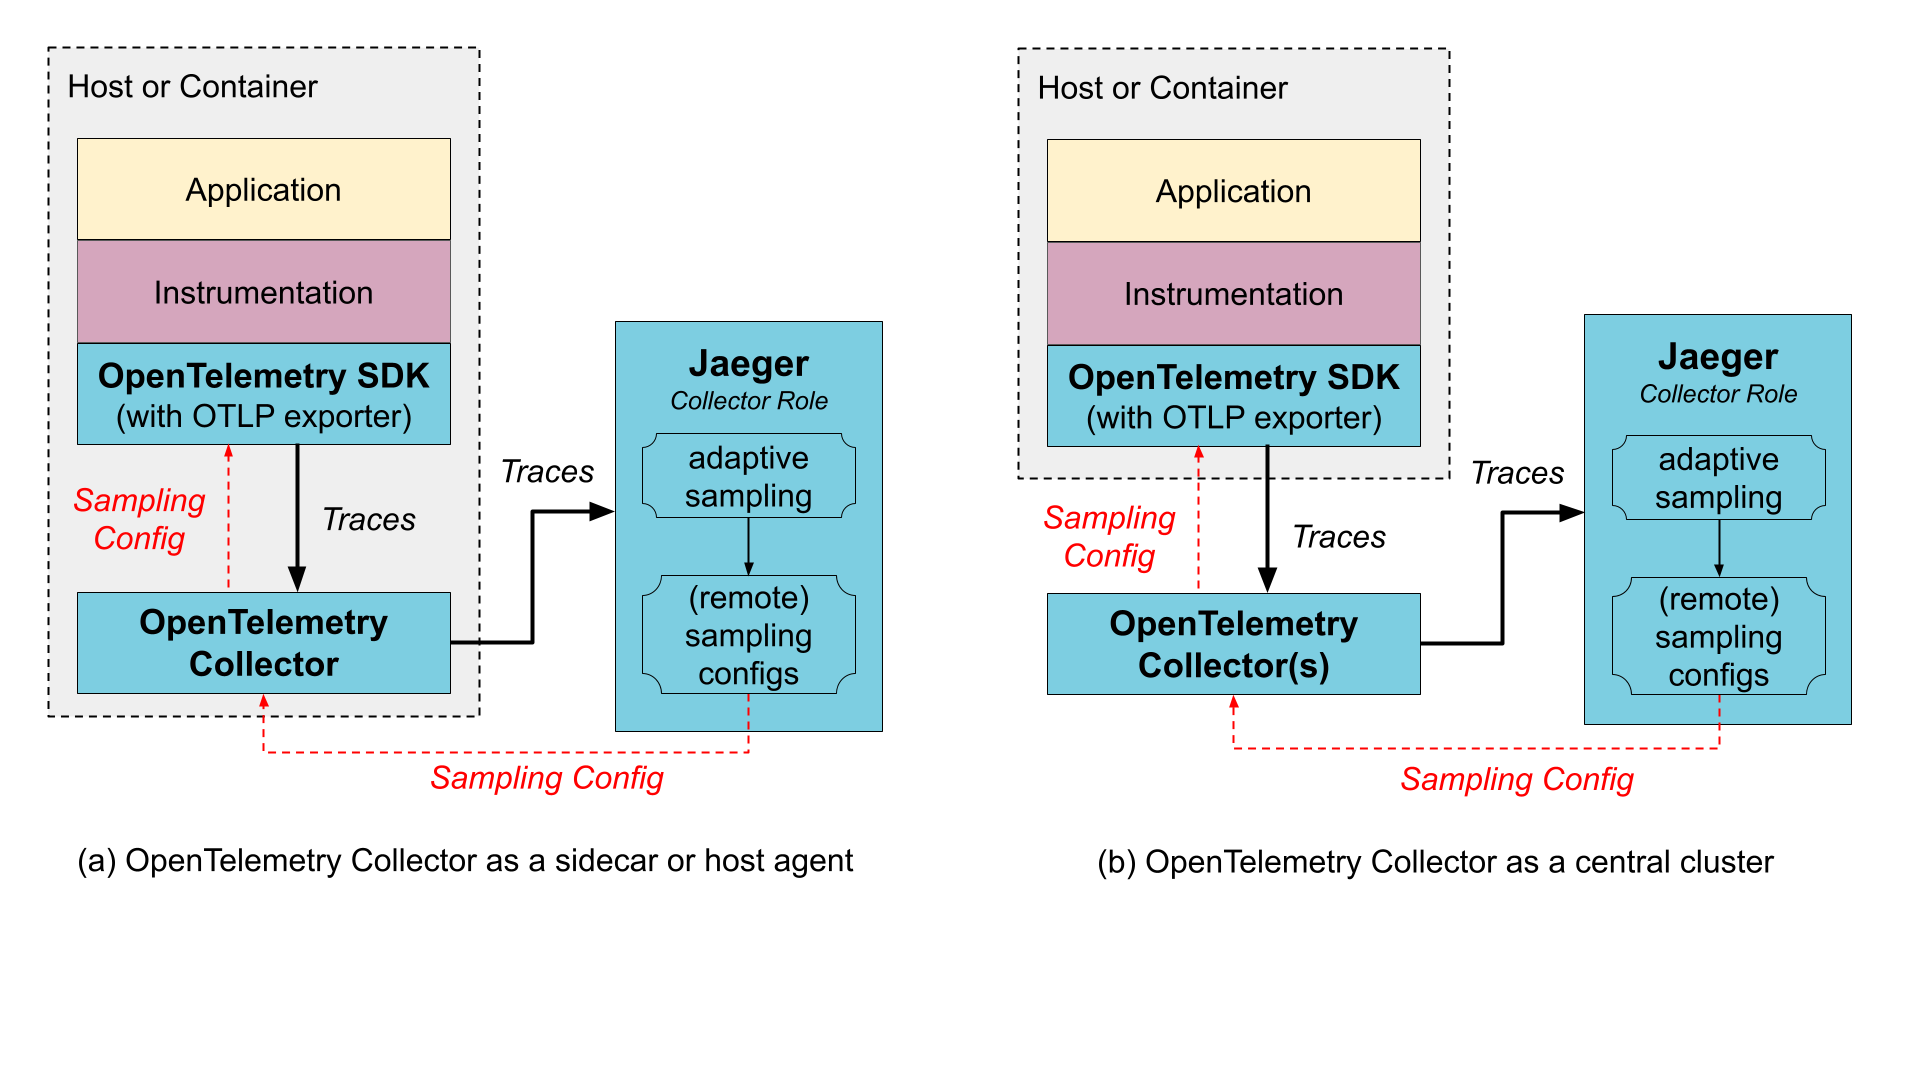
OpenTelemetry Collector as a sidecar / host agent
Benefits:
- The SDK configuration is simplified as both trace export endpoint and sampling config endpoint can point to a local host and not worry about discovering where those services run remotely.
- Collector may provide data enrichment by adding environment information, like k8s pod name.
- Resource usage for data enrichment can be distributed across all application hosts.
Downsides:
- An extra layer of marshaling/unmarshaling the data.
OpenTelemetry Collector as a remote cluster
Benefits:
- Sharding capabilities, e.g., when using tail-based sampling .
Downsides:
- An extra layer of marshaling/unmarshaling the data.
Jaeger Binary
The Jaeger binary is build on top of the OpenTelemetry Collector framework and includes:
- Official upstream components, such as OTLP Receiver, Batch and Attribute Processor, etc.
- Upstream components from
opentelemetry-collector-contrib, such as Kafka Exporter and Receiver, Tail Sampling Processor, etc. - Jaeger own components, such as Jaeger Storage Exporter, Jaeger Query Extension, etc.
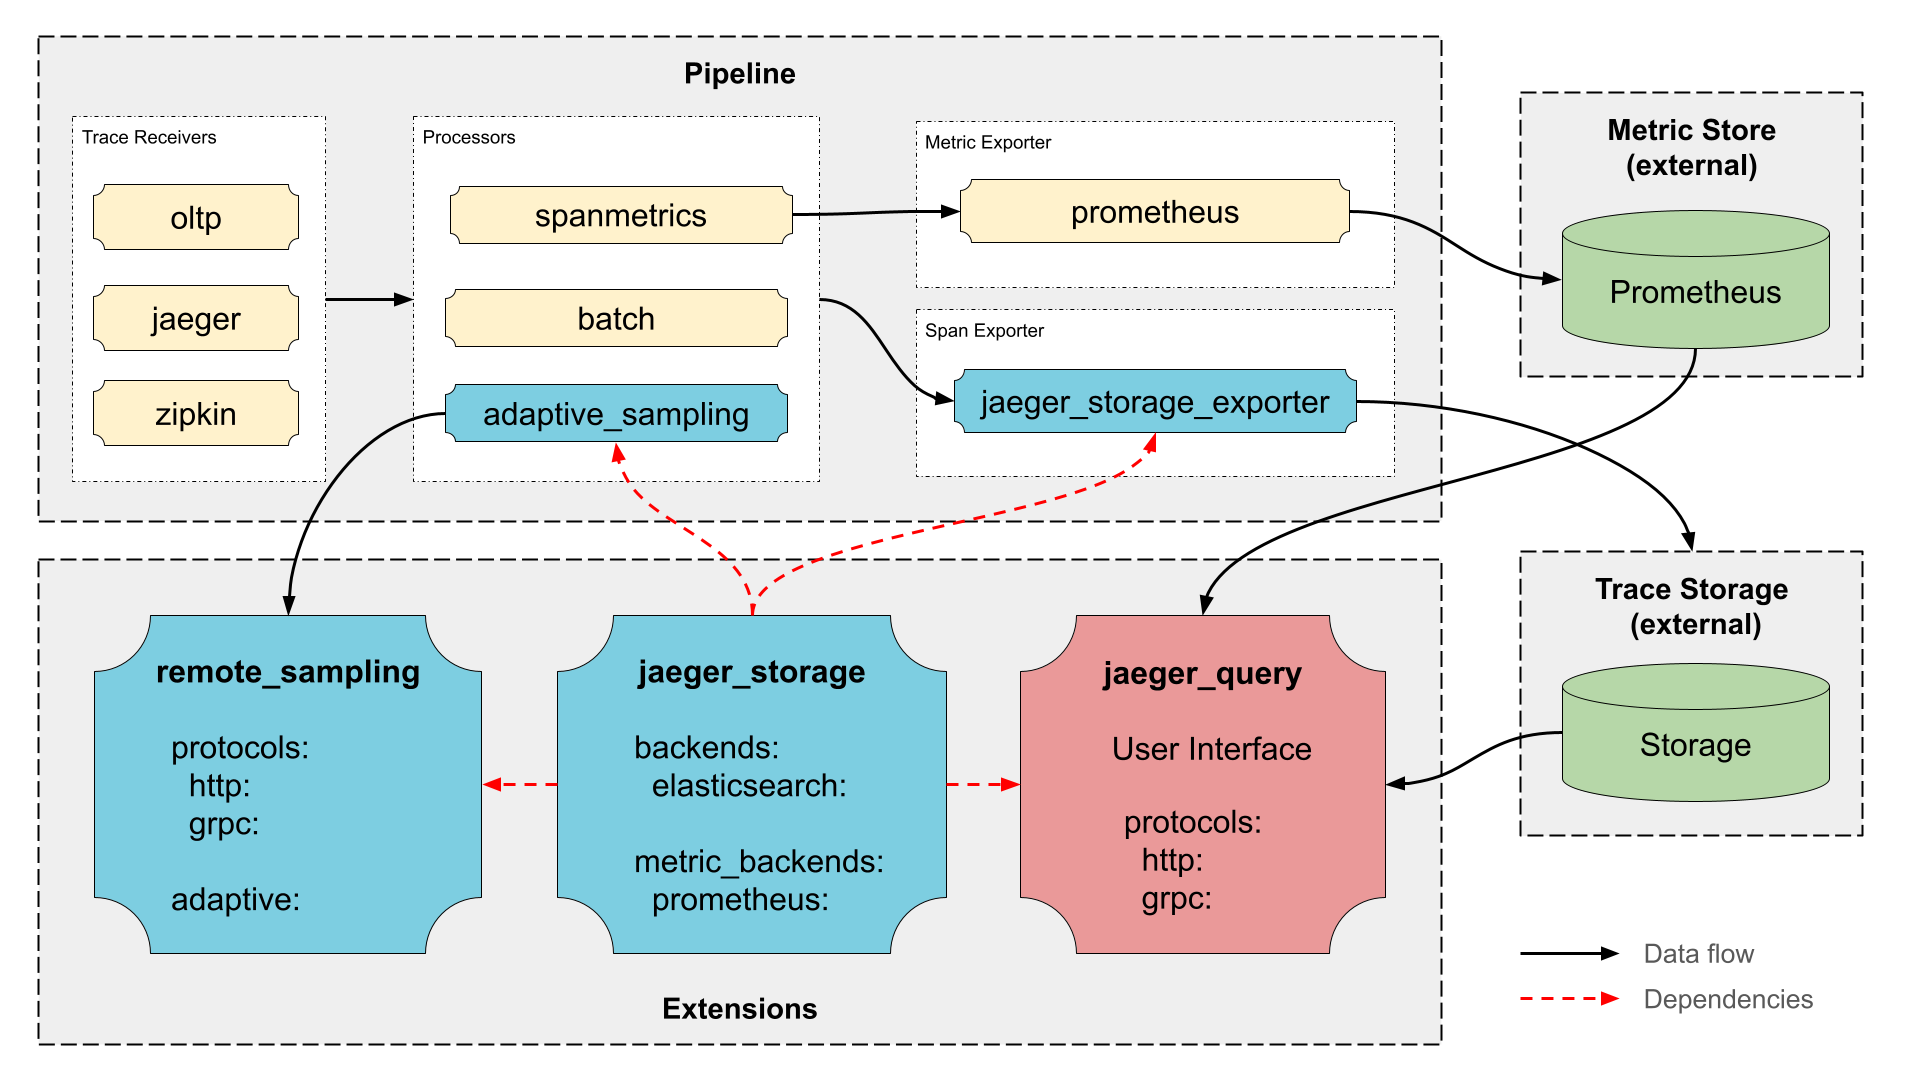
Jaeger Components
Jaeger Storage Extension - Extensible hub for storage backends supported in Jaeger. It provides all other Jaeger components access to Jaeger storage implementations.
Jaeger Storage Exporter - Writes spans to storage backend configured in the Jaeger Storage Extension.
Jaeger Query Extension - Run the query APIs and the Jaeger UI.
Adaptive Sampling Processor - Performs probabilities calculations for adaptive sampling.
Remote Sampling Extension - Serves the endpoints for Remote Sampling, based on static configuration file or adaptive sampling.
OpenTelemetry Components
Receivers
OTLP - Accepts spans sent via OpenTelemetry Protocol (OTLP).
Jaeger - Accepts Jaeger formatted traces transported via gRPC or Thrift protocols.
Kafka - Accepts spans from Kafka in various formats (OTLP, Jaeger, Zipkin).
Zipkin - Accepts spans using Zipkin v1 and v2 protocols.
No-op - Used for Jaeger UI / query service deployment that does not require an ingestion pipeline.
Processors
Batch Processor - Batches spans for better efficiency.
Tail Sampling - Supports advanced post-collection sampling.
Memory Limiter - Supports back-pressure when the collector is overloaded.
Attributes Processor - Allows filtering, rewriting, and enriching spans with attributes. Can be used to redact sensitive data, reduce data volume, or attach environment information.
Filter Processor - Allows dropping spans and span events from the collector (⚠️ may cause broken traces).
Exporters
OTLP - Send data in OTLP format via gRPC.
OTLP HTTP - Sends data in OTLP format over HTTP.
Kafka - Sends data to Kafka in various formats (OTLP, Jaeger, Zipkin).
Prometheus - Sends metrics to Prometheus.
Debug - Debugging tool for pipelines.
No-op - Used for Jaeger UI / query service deployment that does not require an ingestion pipeline.
Connectors
Span Metrics - Generates metrics from span data.
Forward - Redirects telemetry between pipelines in the collector (ex: span to metric / span to log)
Extensions
Health Check v2 - Supports health checks.
zPages - Exposes internal state of the collector for debugging.
Performance Profiler (pprof) - enables Go’s
net/http/pprofendpoint, typically used by developers to collect performance profiles and investigate issues with the collector.
