Introduction
See also:
Welcome to Jaeger’s documentation! Below, you’ll find information for beginners and experienced Jaeger users. If you cannot find what you are looking for, or have an issue not covered here, we’d love to hear from you.
If you are new to distributed tracing, please take a look at the Related Links section below.
About
Jaeger is a distributed tracing platform released as open source by Uber Technologies and donated to Cloud Native Computing Foundation where it is a graduated project.
With Jaeger you can:
- Monitor and troubleshoot distributed workflows
- Identify performance bottlenecks
- Track down root causes
- Analyze service dependencies
Uber published a blog post, Evolving Distributed Tracing at Uber , where they explain the history and reasons for the architectural choices made in Jaeger. Yuri Shkuro , creator of Jaeger, also published a book Mastering Distributed Tracing that covers in-depth many aspects of Jaeger design and operation, as well as distributed tracing in general.
Features
- OpenTracing -inspired data model
- OpenTelemetry compatible
- Multiple built-in storage backends: Cassandra, Elasticsearch, OpenSearch, and in-memory
- Community supported external storage backends via the gRPC plugin: ClickHouse
- System topology graphs
- Adaptive sampling
- Service Performance Monitoring (SPM)
- Post-collection data processing
See Features page for more details.
Technical Specs
- Backend components implemented in Go
- React/Javascript UI
- Supported storage backends:
- Cassandra 4+
- Elasticsearch 7.x, 8.x
- Badger
- Kafka - as an intermediate buffer
- memory storage
- Custom backends via Remote Storage API
Quick Start
See Getting Started.
Screenshots
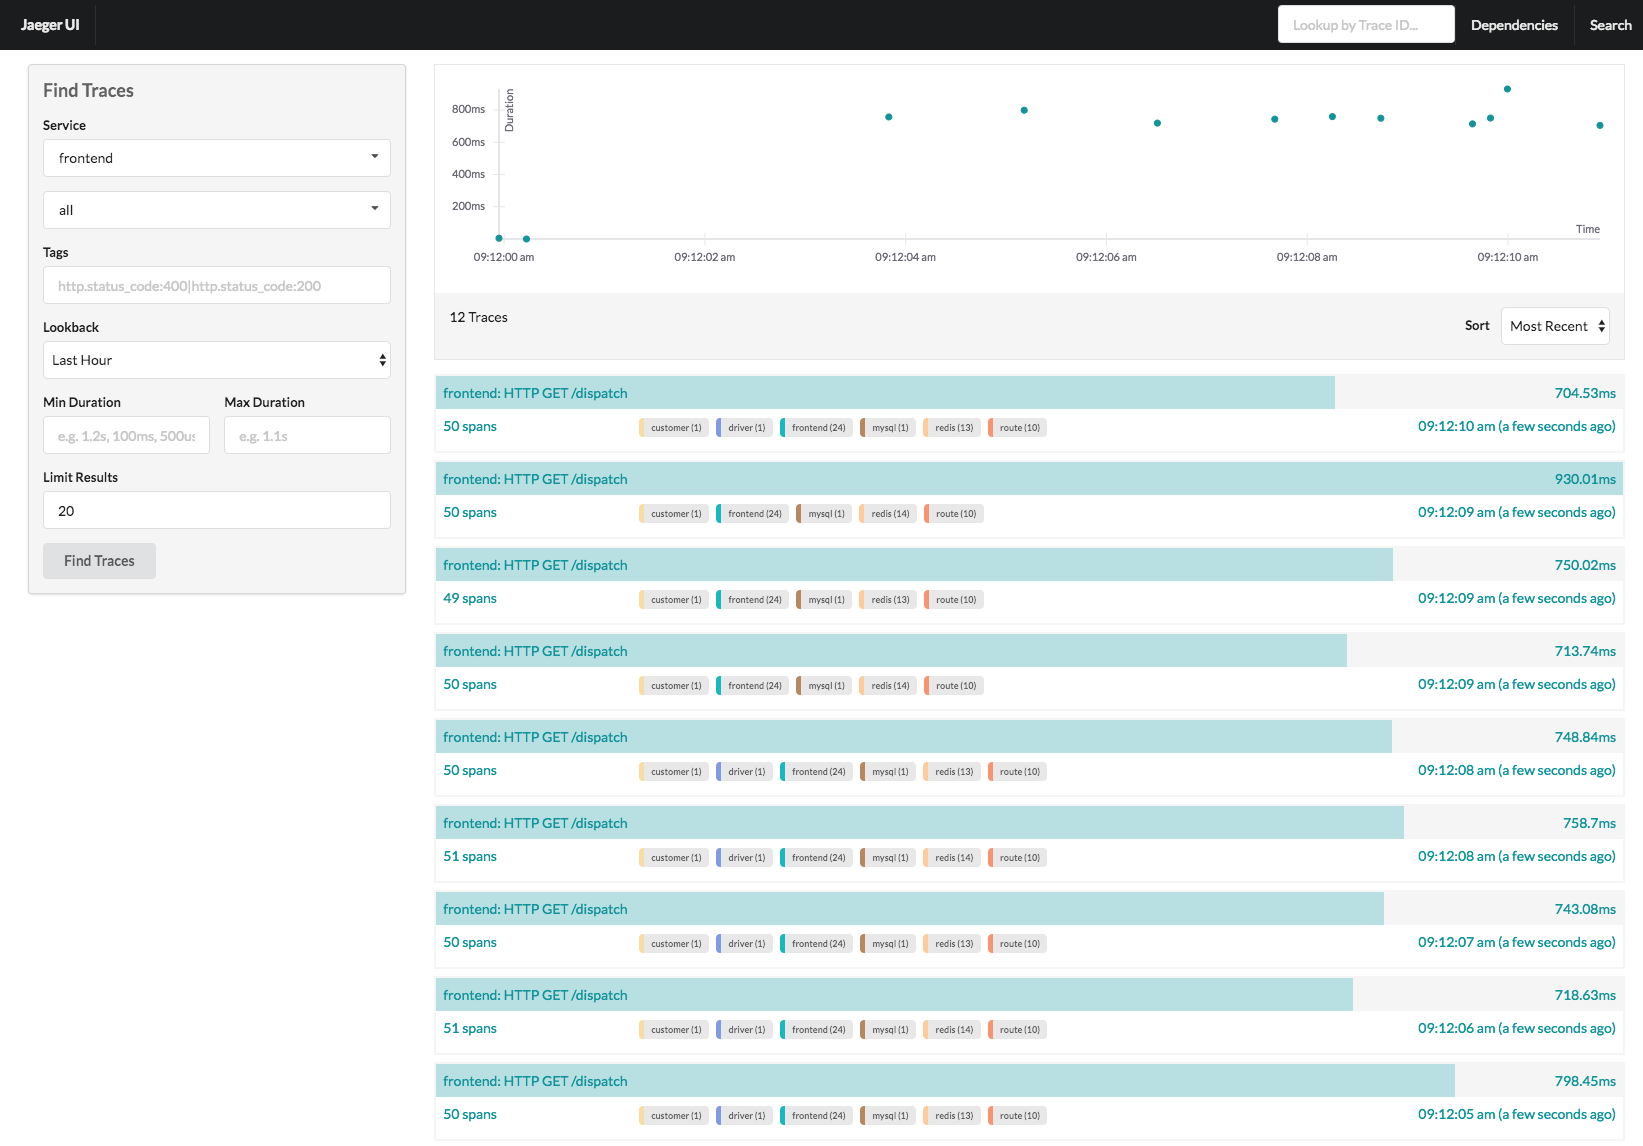
Traces View
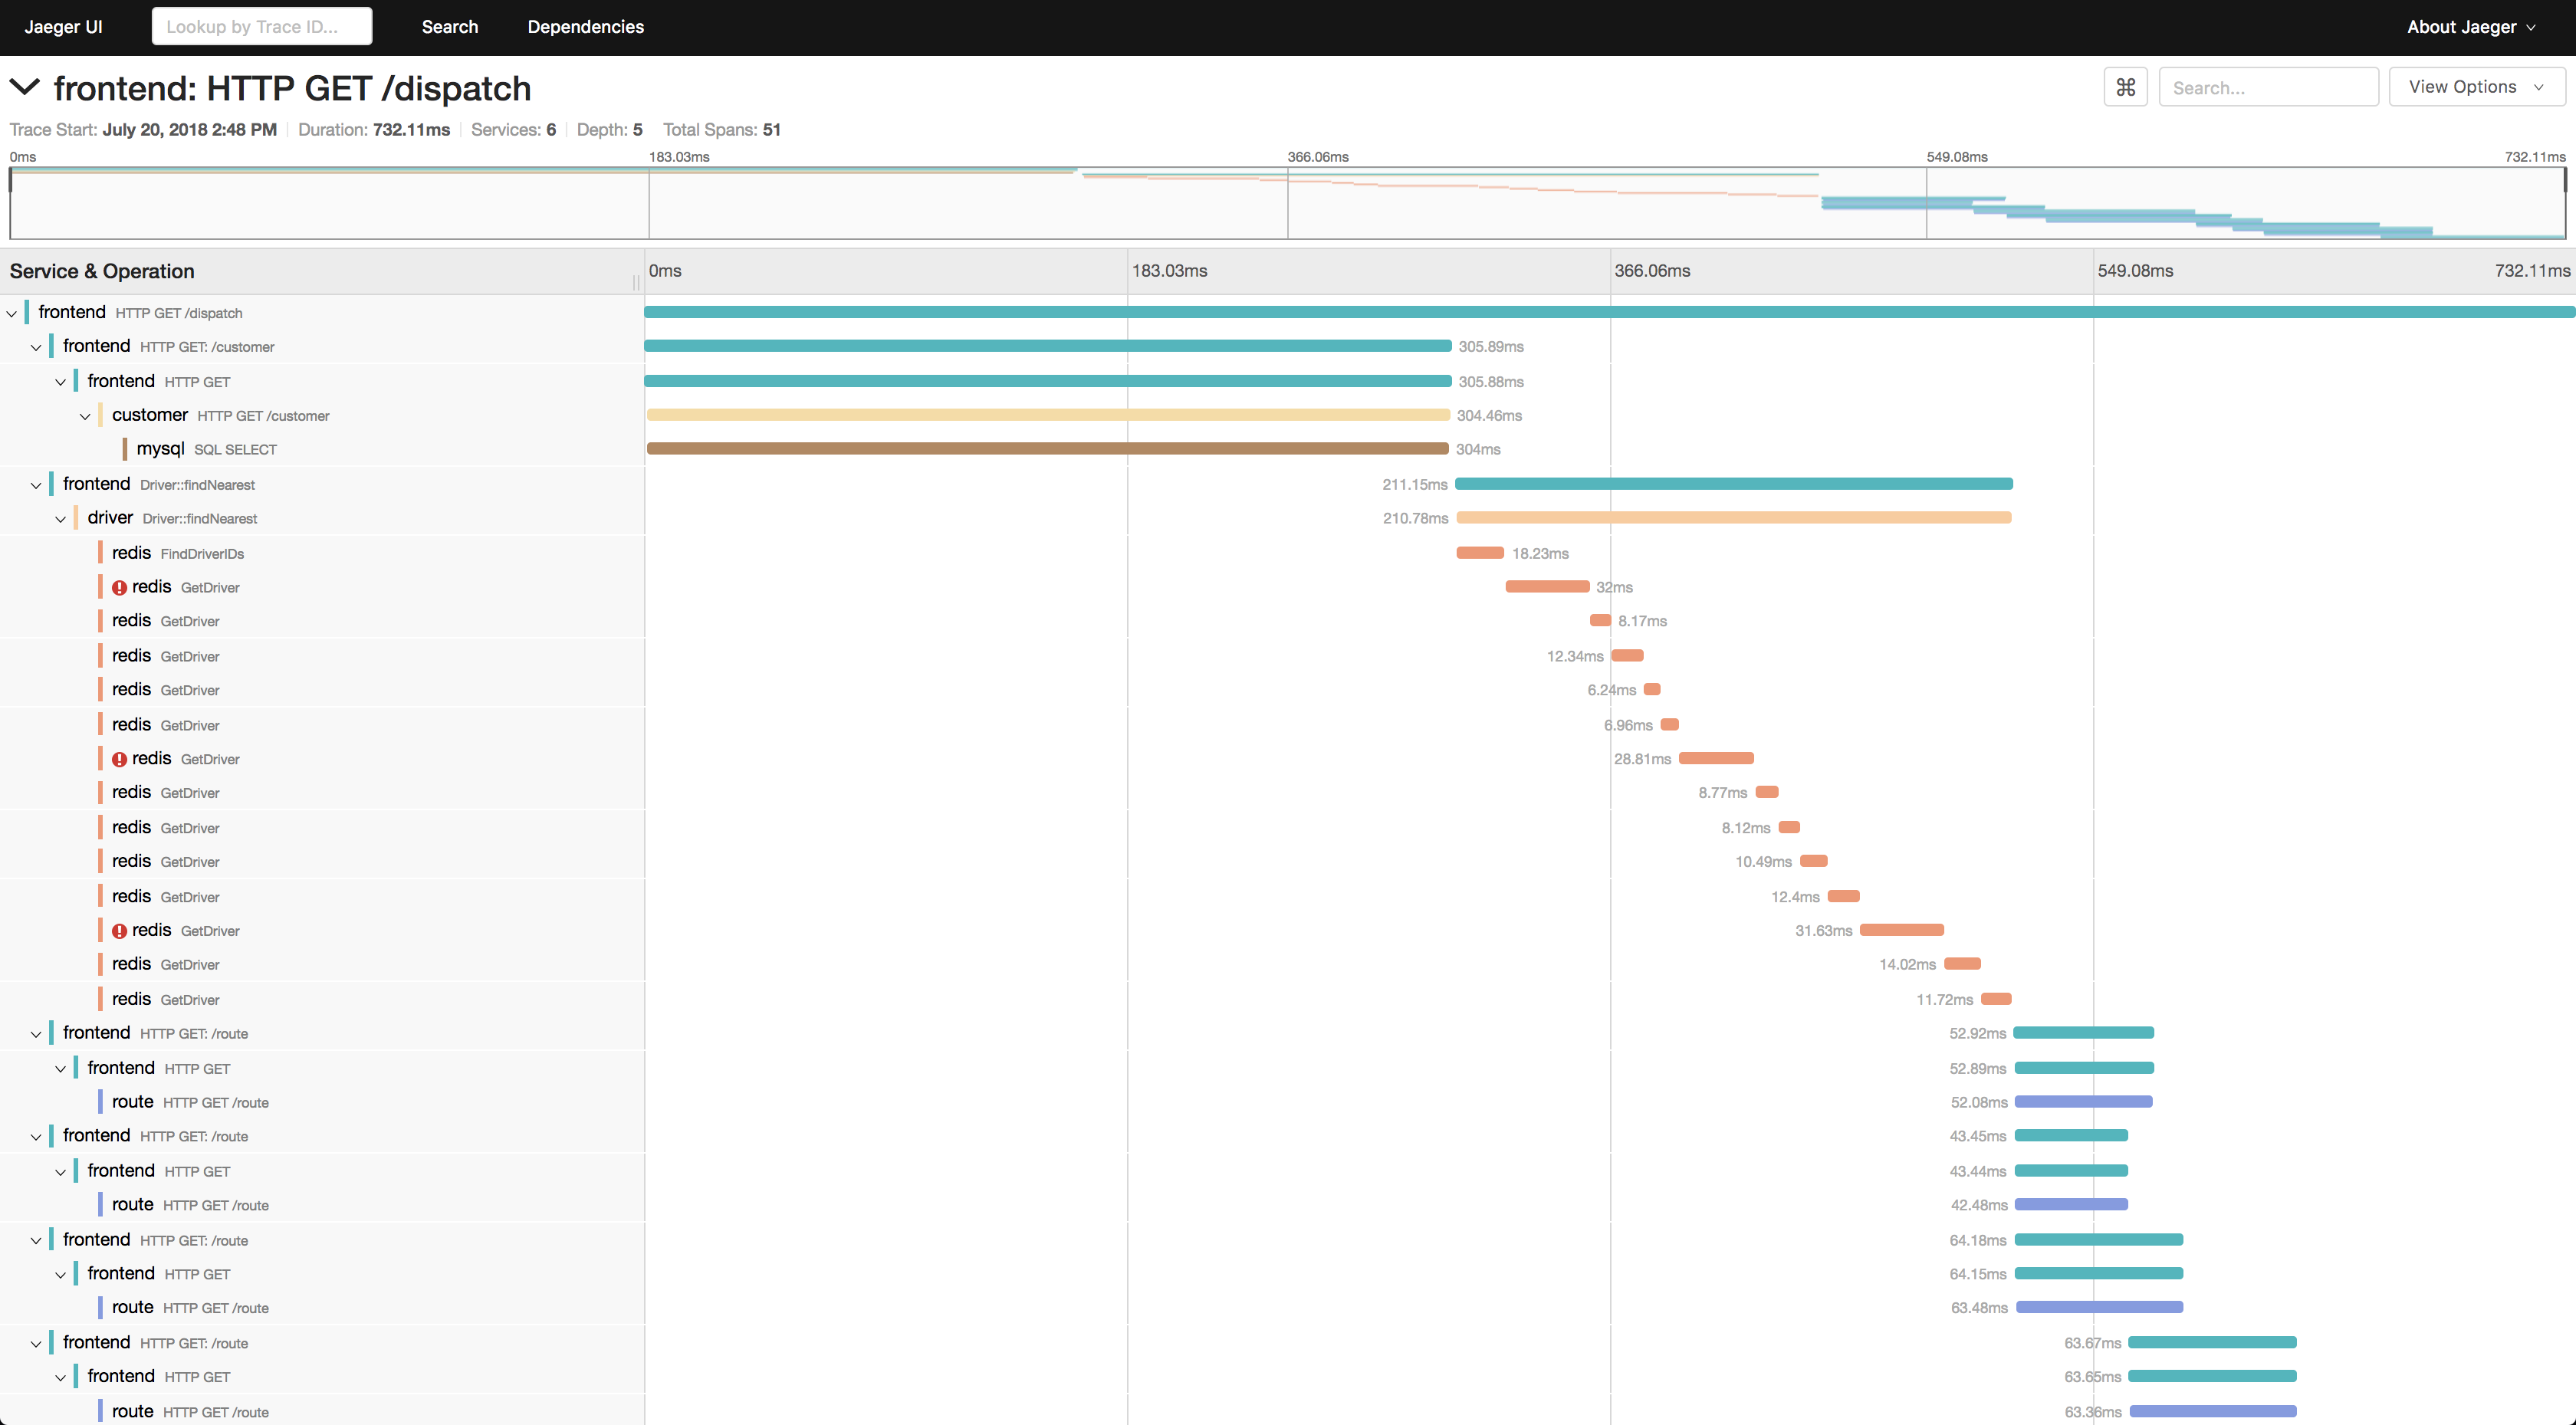
Trace Detail View
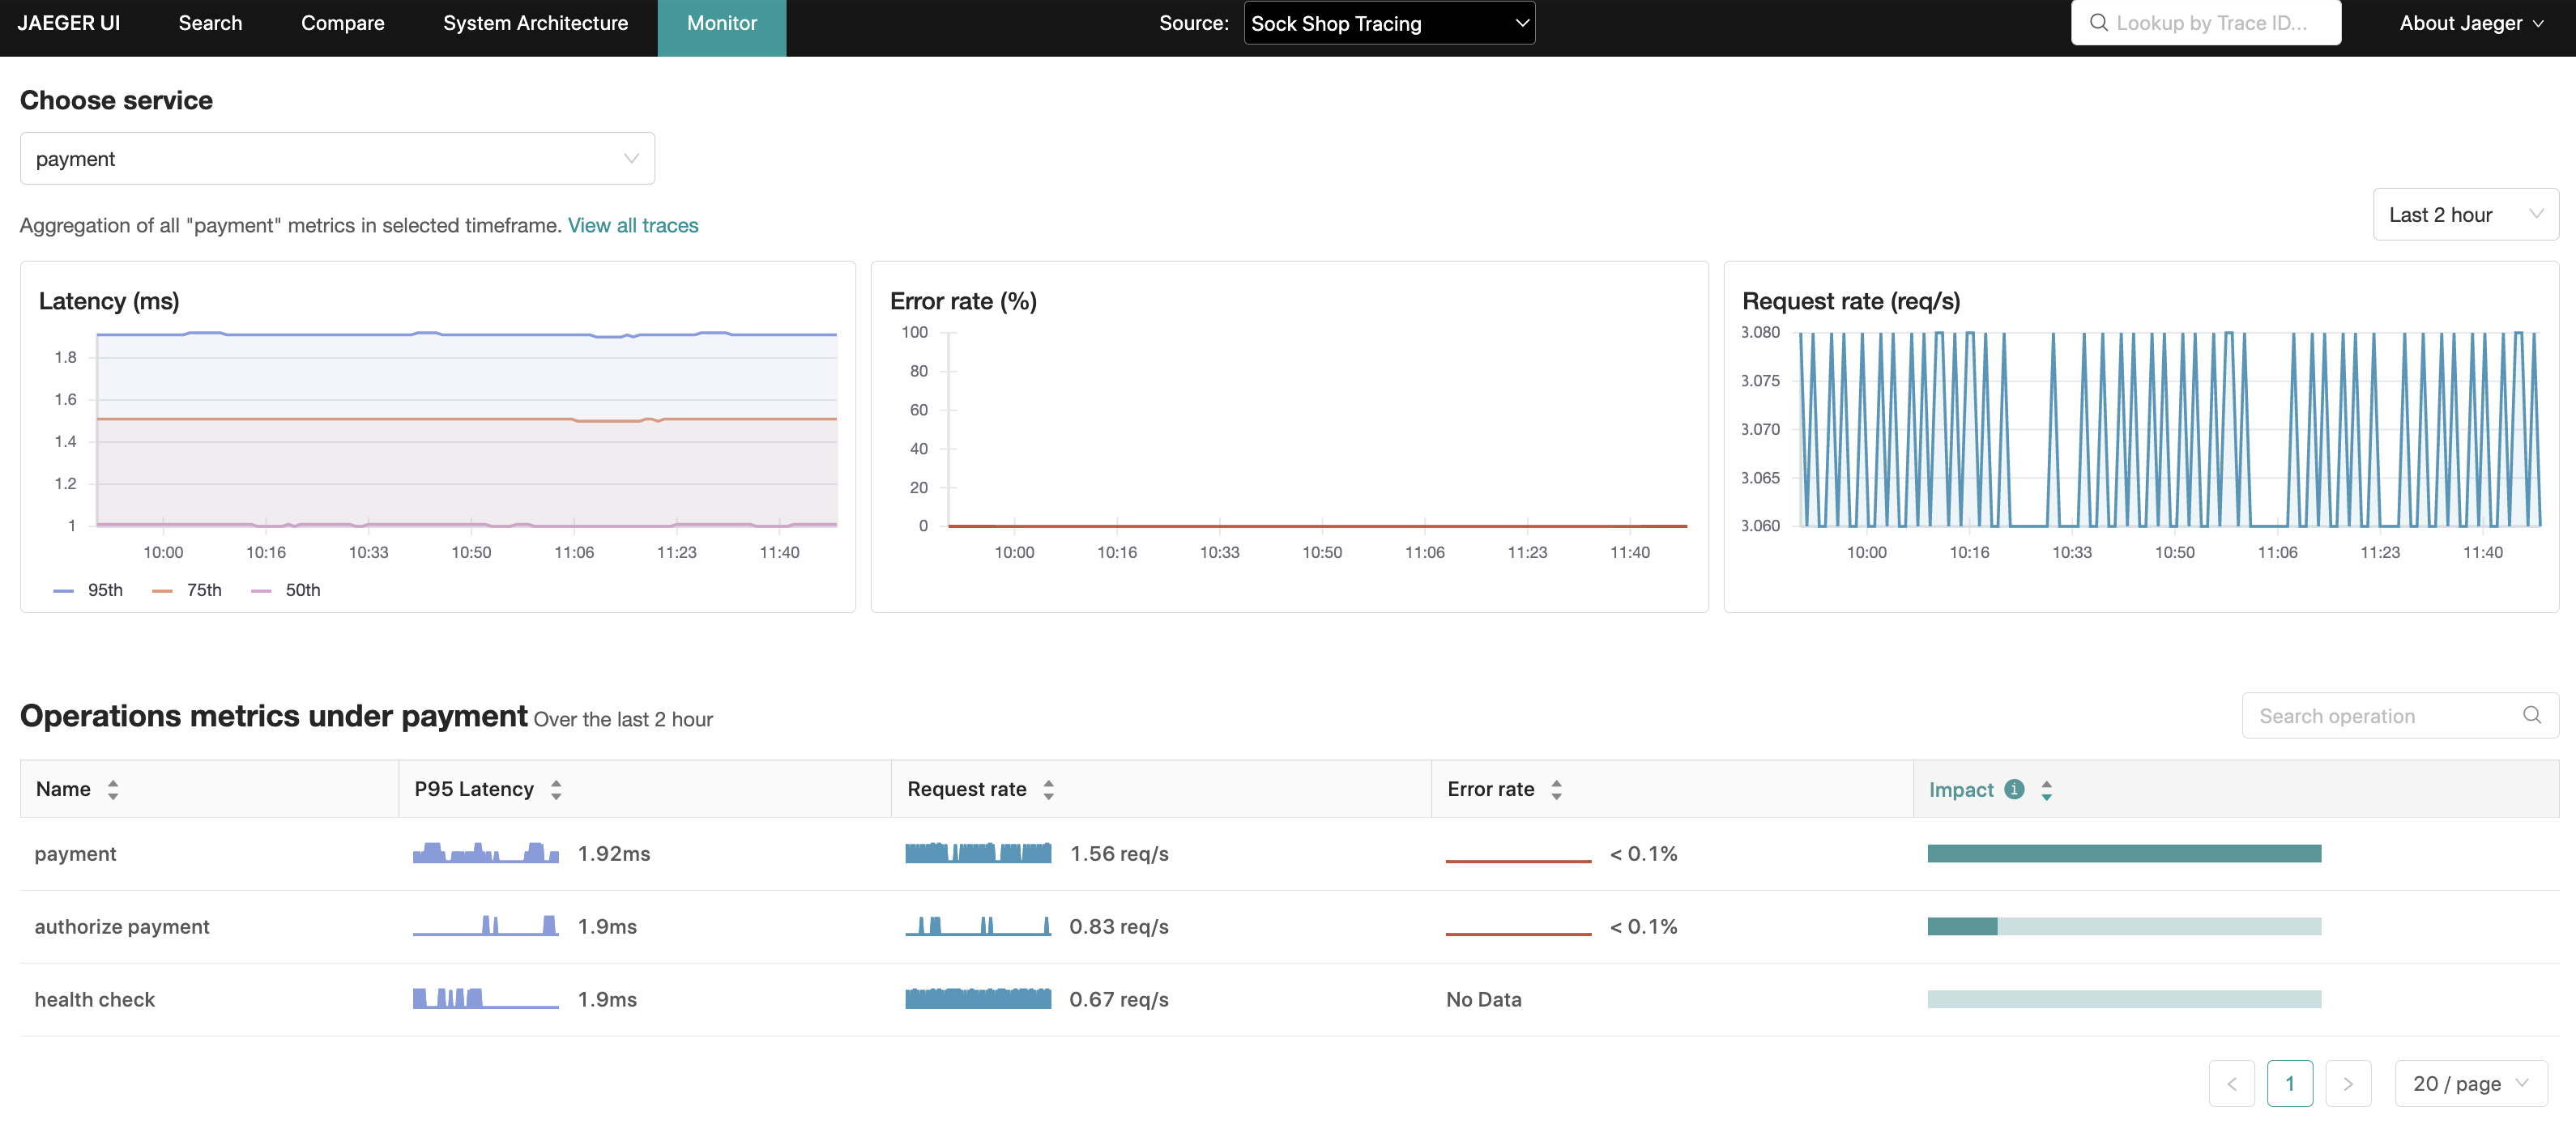
Service Performance Monitoring View

 We stand with our friends and colleagues in Ukraine.
To support Ukraine in their time of need

